Support reports
See how many conversations your team handled, how fast it answered, what the AI did, how satisfied customers were and what it sold, for any period.
Updated on
On this page
The support report answers the questions owners ask every Monday: how many customers wrote to us, did anyone wait, how fast did we answer, how much did the AI take off our hands, were customers happy, and what did the conversations sell.
Open it from Customer Support → Reports. Everyone with View access to Customer Support can see it.
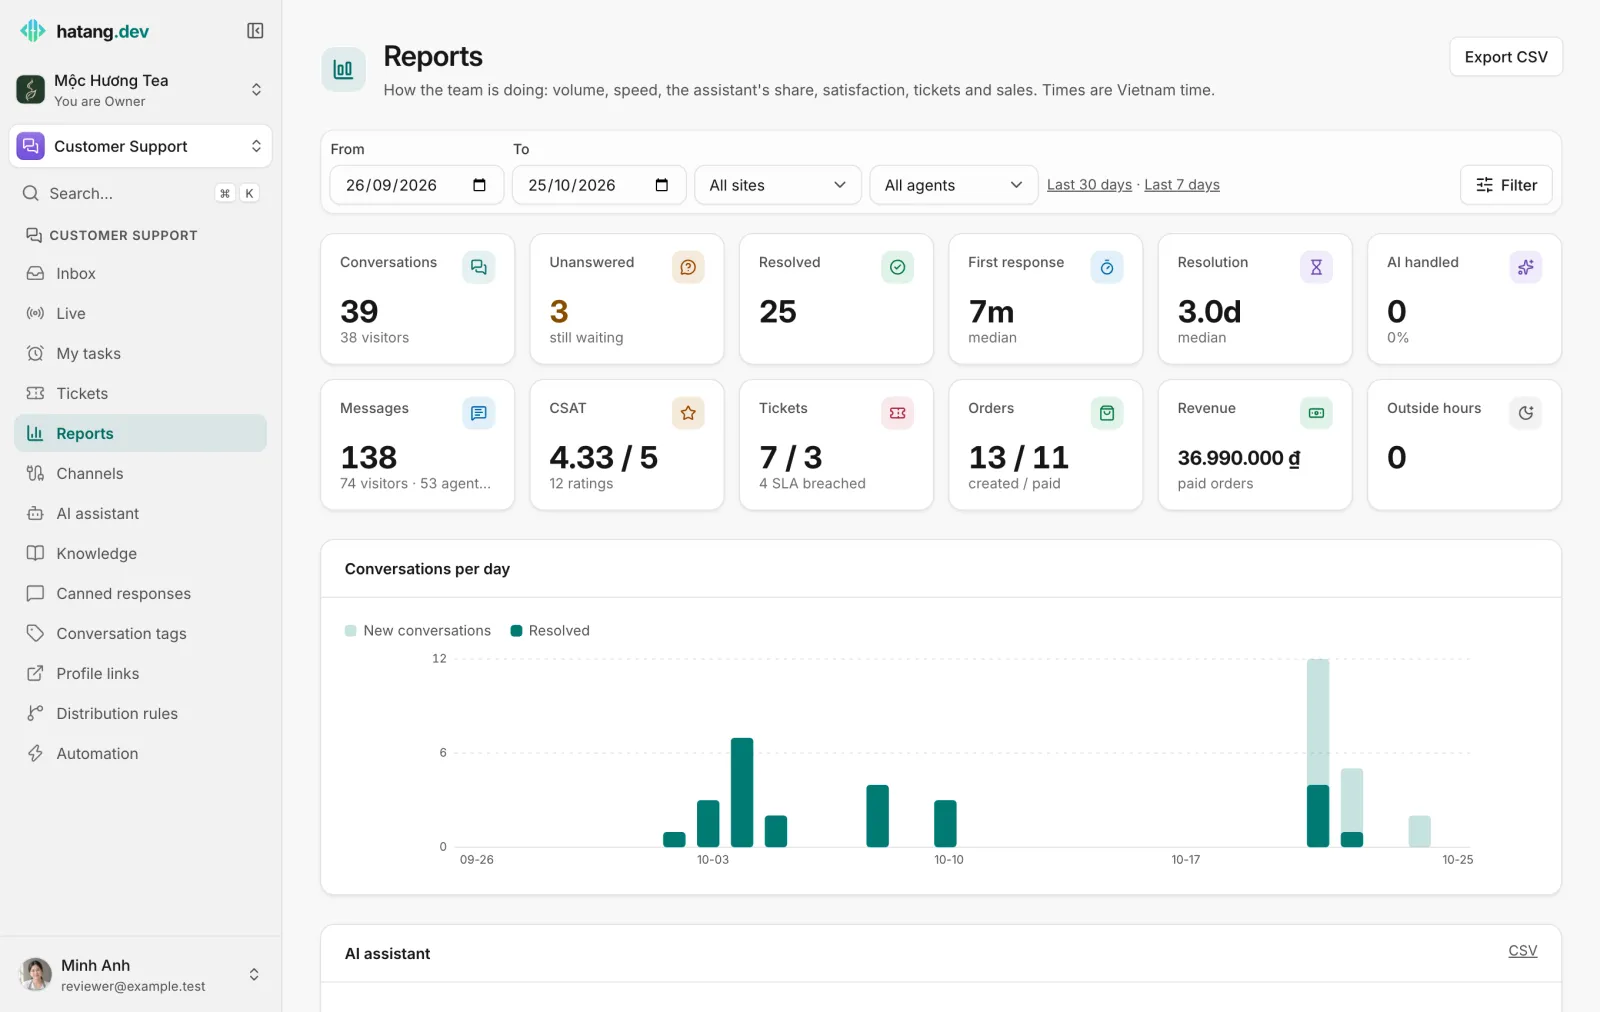
Choose the period
The report covers the last 30 days by default.
- Pick dates in From and To and click Filter. Both days are included, counted in Vietnam time.
- Last 30 days and Last 7 days are shortcuts.
- All sites narrows the report to one website and the channels attached to it.
- All agents narrows it to the conversations assigned to one employee.
A conversation belongs to the day it started. A conversation that started on the 30th and was resolved on the 2nd counts in the period that contains the 30th.
The key numbers
| Number | What it counts |
|---|---|
| Conversations | Conversations started in the period, and how many different visitors started them |
| Unanswered | Conversations still open or pending that nobody has answered yet. These customers are waiting now |
| Resolved | Conversations started in the period that have been resolved |
| First response | The median time from the customer's first message to the first answer |
| Resolution | The median time from the start of a conversation to its resolution |
| AI handled | Conversations the AI assistant answered without any employee replying publicly, and their share of all conversations |
| Messages | All messages, split into visitors, agents and bots (internal notes are not counted) |
| CSAT | The average satisfaction rating out of 5 and the number of ratings (see Satisfaction ratings) |
| Tickets | Tickets created / resolved, and how many breached their SLA |
| Orders | Orders created / paid (drafts from the assistant are not counted) |
| Revenue | The total of the paid orders |
| Outside hours | Conversations that started outside your office hours |
The median is the middle value: half of the conversations were faster, half slower. Unlike an average, one conversation that waited all weekend does not distort it.
Charts and tables
- Conversations per day: new conversations each day, with the resolved ones in the darker color. Hover a bar for the exact numbers.
- AI assistant: conversations the assistant took part in, the ones it handled alone, hand-offs to a human and why, satisfaction of AI-only conversations against human ones, cost and unanswered questions. See AI runs.
- By channel: conversations, resolved and first response per channel. Chats from your mobile app are counted apart from the website.
- Top tags: the conversation tags used most in the period.
- Agents: one row per employee. See Agent performance.
- Latest ratings: the most recent ratings with comments, each linking to its conversation.
Export the numbers
- Export CSV at the top downloads the numbers per day: conversations, new and returning visitors, conversations per channel and resolved.
- The CSV link next to a section downloads that table: AI assistant per day, channels, tags or agents.
The files follow the period and filters you chose. Open them in Excel or Google Sheets to build your own charts.
Reading the report well
- Look at Unanswered first. It is the only number about right now: customers waiting for an answer.
- A rising First response usually means too few people at busy hours. Compare Conversations per day with who was working, and look at Distribution rules.
- If AI handled is high but CSAT for AI conversations is lower than for people, read the conversations it handled alone and improve its knowledge.
- For a report you open every week, with only the numbers you care about, make a custom report: see Custom dashboards and reports.
Useful next steps
Was this article helpful?
Related articles
- Agent performanceCompare how many conversations each employee handled, how fast they answered, how customers rated them and what they sold.
- Satisfaction ratings (CSAT)Ask customers to rate each resolved conversation, with stars on your website and quick replies on Zalo, Messenger and Instagram, and read the results.
- Custom dashboards and reportsBuild pages of widgets from every module, such as sales, support, payments and email, for your team's daily view and for period reports you can print.
- Check what the AI did and what it costThe AI runs log shows every answer, draft, hand-off and test the assistant made in the last 30 days, with its outcome and cost.
Not finding what you are looking for?
Our team answers in the chat, in English or Vietnamese.