Custom dashboards and reports
Build pages of widgets from every module, such as sales, support, payments and email, for your team's daily view and for period reports you can print.
Updated on
On this page
Dashboards and reports put the numbers your business cares about on one page, taken from every app you use: orders and revenue, conversations and response times, payments received, emails delivered. Owners and admins arrange them; every employee can read them.
They live in the Dashboards app, the first one in the app menu. Its sidebar has two groups: Dashboards and Reports, each with its pages and an Edit dashboards or Edit reports link.
Dashboards or reports
| Dashboard | Report | |
|---|---|---|
| Made for | The daily look: what is happening now | A period: last week, last month, a campaign |
| Dates | Each widget has its own period (last 7, 30 or 90 days) | One date range for the whole page, with From, To and shortcuts for the last 7, 30 and 90 days |
| Printing | No | Print / save PDF |
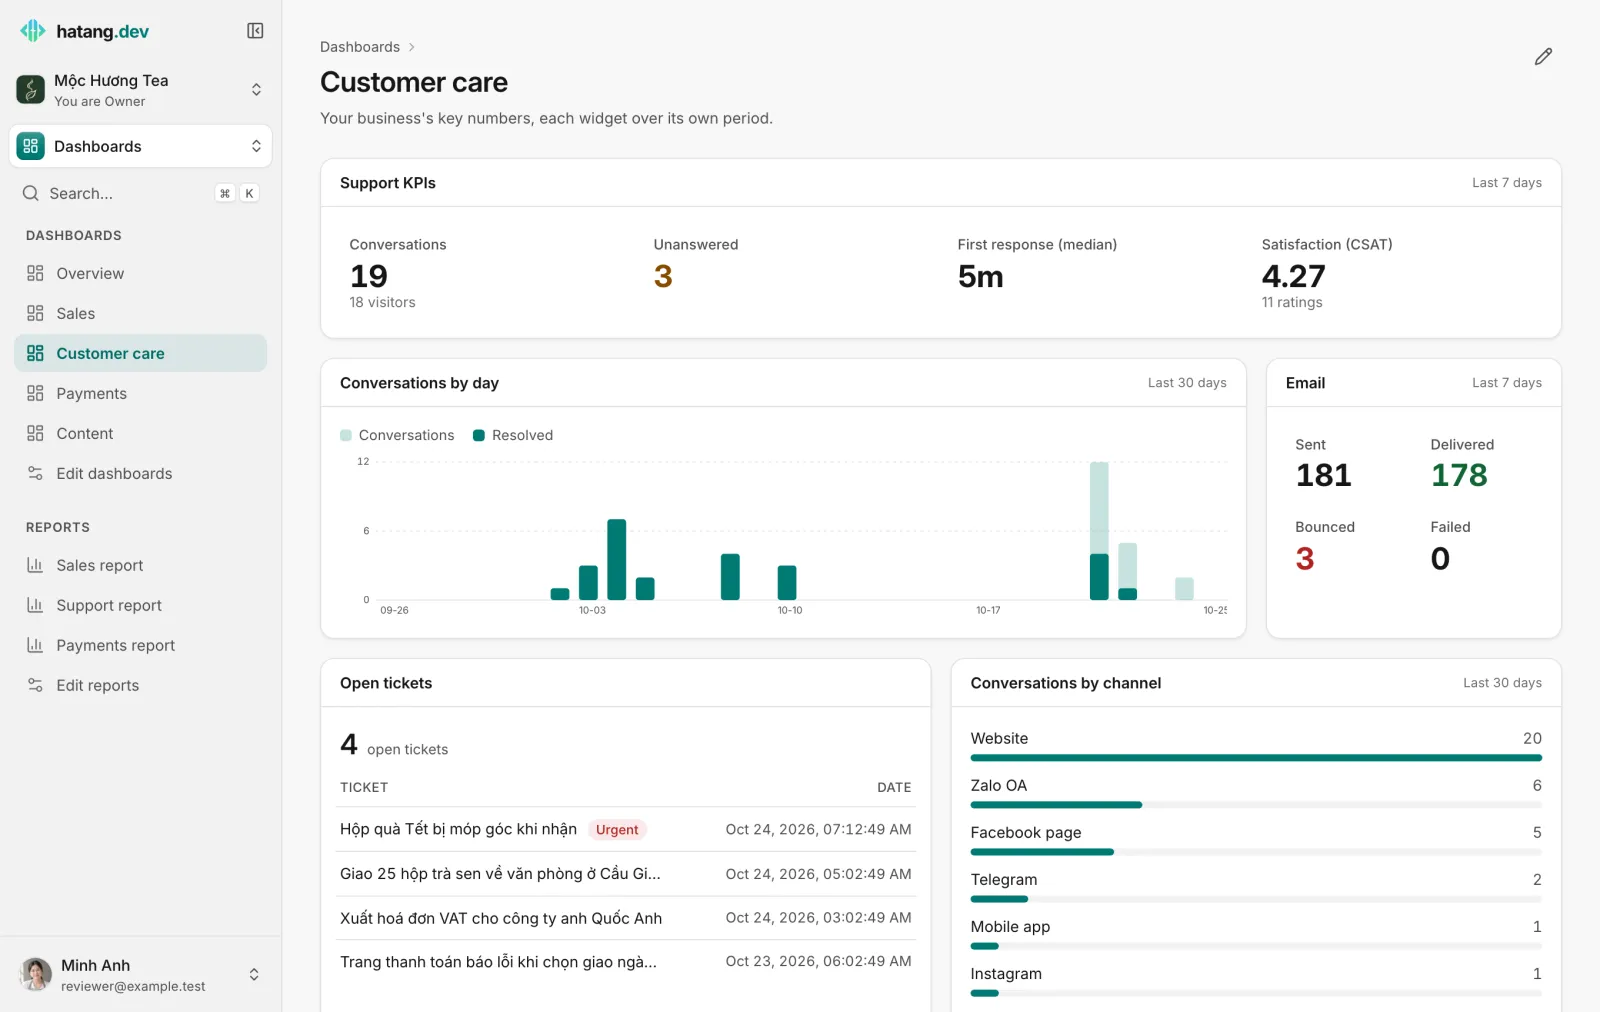
When you open the business, the default dashboard opens first.
What you start with
Every business gets Ha Tang's templates for the apps it has turned on:
- Dashboards: Overview (the default: key numbers of every app), Sales, Customer care and Payments.
- Reports: Sales report, Support report and Payments report.
Ha Tang creates them once, the first time someone opens the app, and never twice, even if several people open it at the same moment. You can change them, delete them, or add a template again later.
Create a dashboard or report
You need to be an owner or an admin of the business.
- Click Edit dashboards (or Edit reports) in the sidebar.
- Under New dashboard (or New report), type a Name, for example "Sales this week".
- In Template, keep Blank page or pick one of Ha Tang's templates. The list says what each contains.
- Click Create.
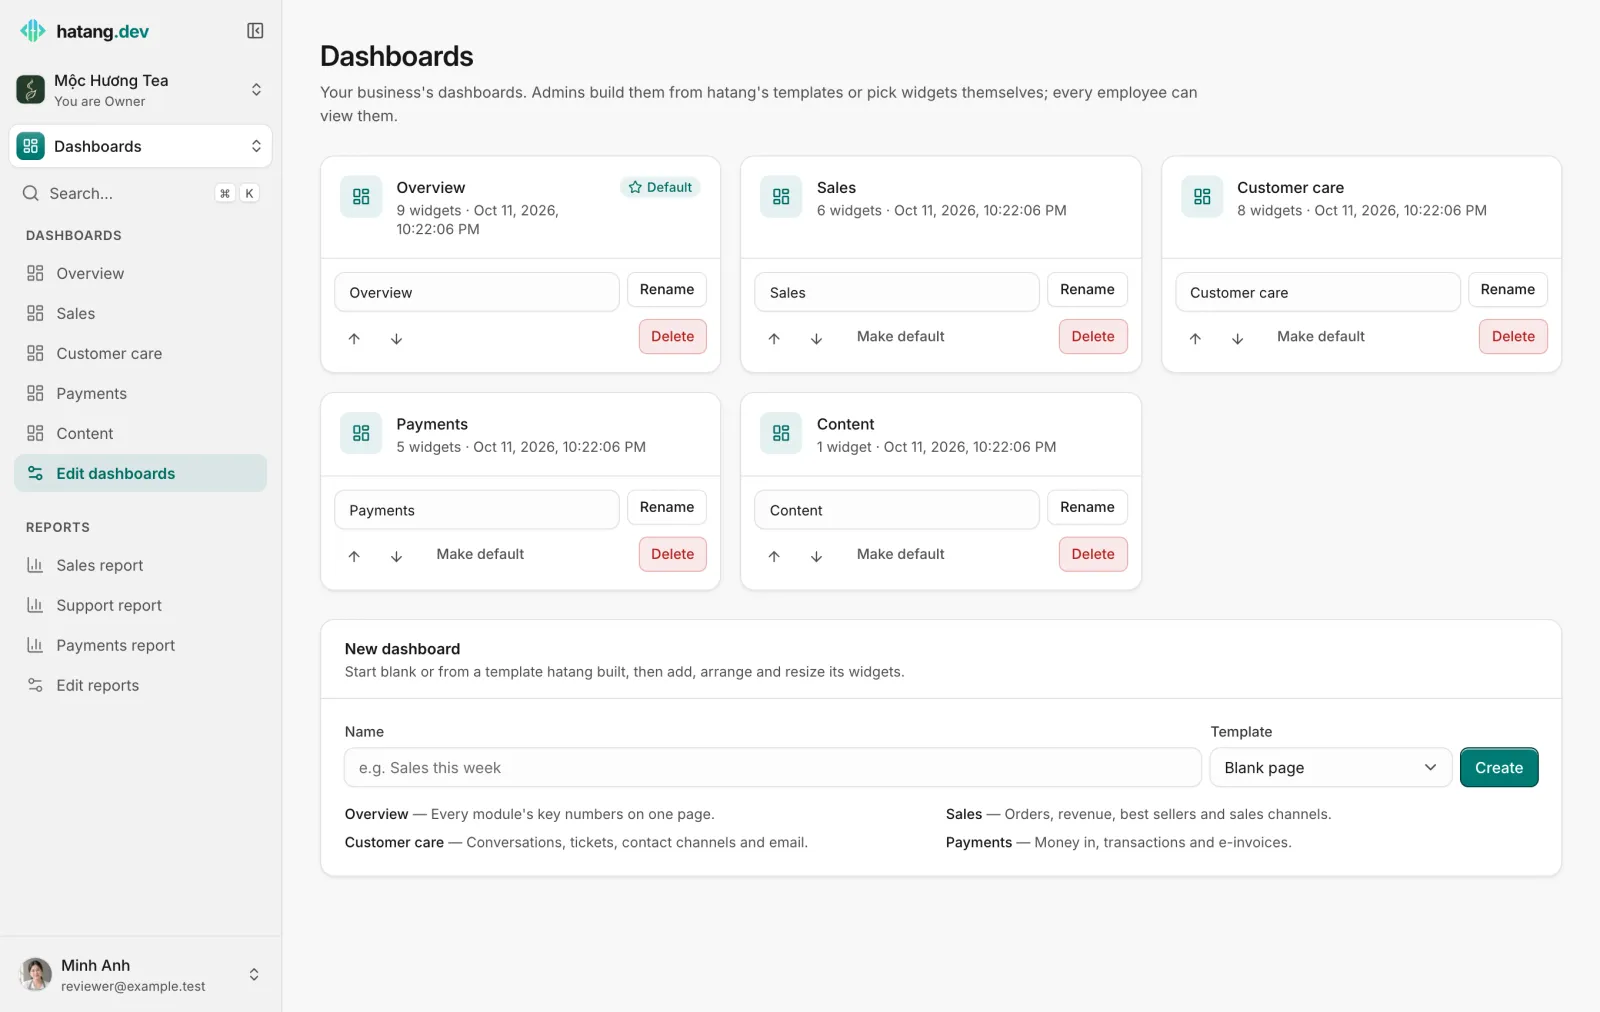
A blank page opens ready to edit. A page made from a template opens with its widgets.
Add and arrange widgets
- Open the dashboard or report and click the pencil icon (Customize) at the top right.
- Click Add widget, search or browse the widgets by app, and click one to add it.
- Arrange the widgets: drag them, or use the arrows Move earlier and Move later.
- On each widget, set the Size (Small (1/4), Medium (1/2), Large (3/4) or Full row), the Period (dashboards only) and, if you like, a Title.
- Click Save layout. Cancel drops your changes.
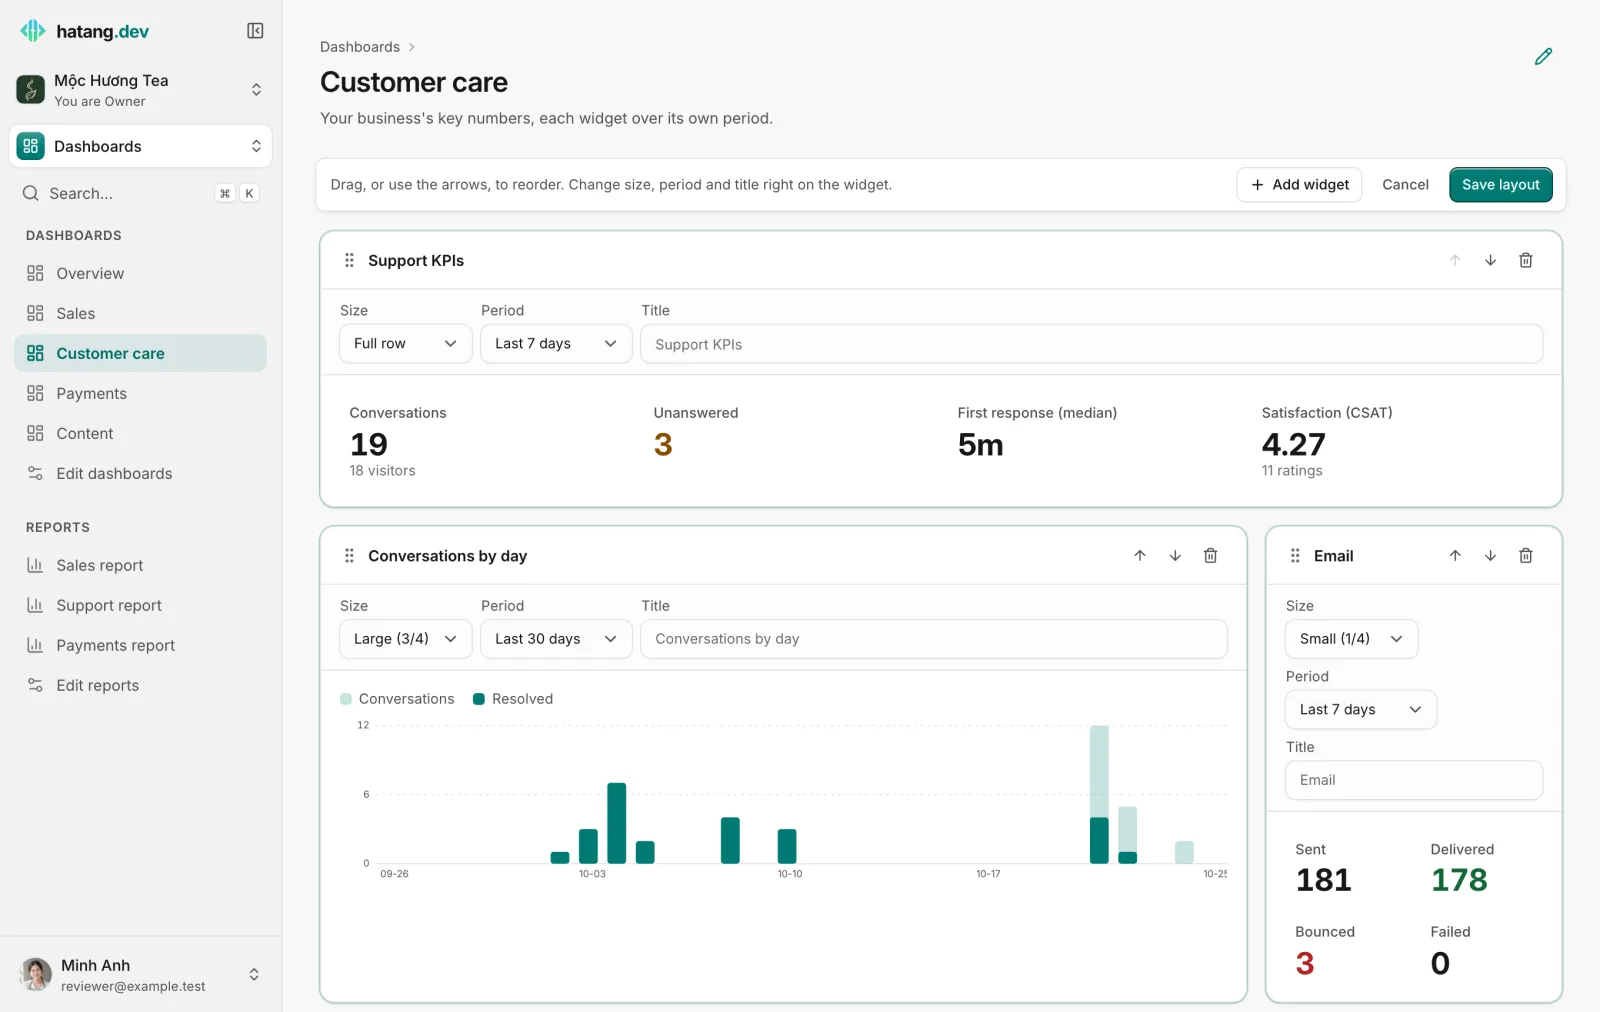
New widgets show their numbers after you save. On phones every widget takes the full width; on tablets, two per row.
Widgets you can add
Each app that is on brings its own widgets, for example:
- Products: Sales KPIs, Orders by day, Best sellers, orders by status and by channel, recent orders.
- Customer Support: Support KPIs, Conversations by day, Conversations by channel, Agent performance, AI assistant, Conversation tags, Recent ratings, open tickets, live visitors.
- CRM: new customers.
- Payments: payment KPIs, money in by day, recent payments and transactions, e-invoices, reconciliation, bank accounts and integration health.
- Email: sending stats and daily quota.
- General: App shortcuts and Note, a block of your own text such as this month's target.
Widgets of an app that is switched off are not offered. A widget only shows data to people who may view its app; others see it empty.
Manage your pages
On Edit dashboards or Edit reports, each page has:
- Rename: type the new name and click it.
- The arrows, to change the order in the sidebar.
- Make default: the dashboard that opens first.
- Delete: removes the page. A business always keeps at least one.
Employees who are not owners or admins see the pages but not the editing buttons.
Print or share a report
Open a report, choose the dates, and click Print / save PDF. Choose "Save as PDF" in the print window to send it by email or Zalo. The page prints without the menus and the date form.
Was this article helpful?
Related articles
- Support reportsSee how many conversations your team handled, how fast it answered, what the AI did, how satisfied customers were and what it sold, for any period.
- Agent performanceCompare how many conversations each employee handled, how fast they answered, how customers rated them and what they sold.
- Satisfaction ratings (CSAT)Ask customers to rate each resolved conversation, with stars on your website and quick replies on Zalo, Messenger and Instagram, and read the results.
- Find your way around the dashboardThe sidebar, the business and app menus, the search box (⌘K) and your account menu - where everything is in Ha Tang.
Not finding what you are looking for?
Our team answers in the chat, in English or Vietnamese.